backstitch Studio provides many features and opportunities to create beautiful and engaging internal communications content.
Now that you’ve gotten started writing some posts, let’s take a look at how to view Engagement Reports.
Step 1: Access Engagement Reports
- Navigate to your Studio Post Manager.
- Select your username on the top right corner to see a drop down menu.
- Select [Engagement Reports] from the drop down menu to view analytics.
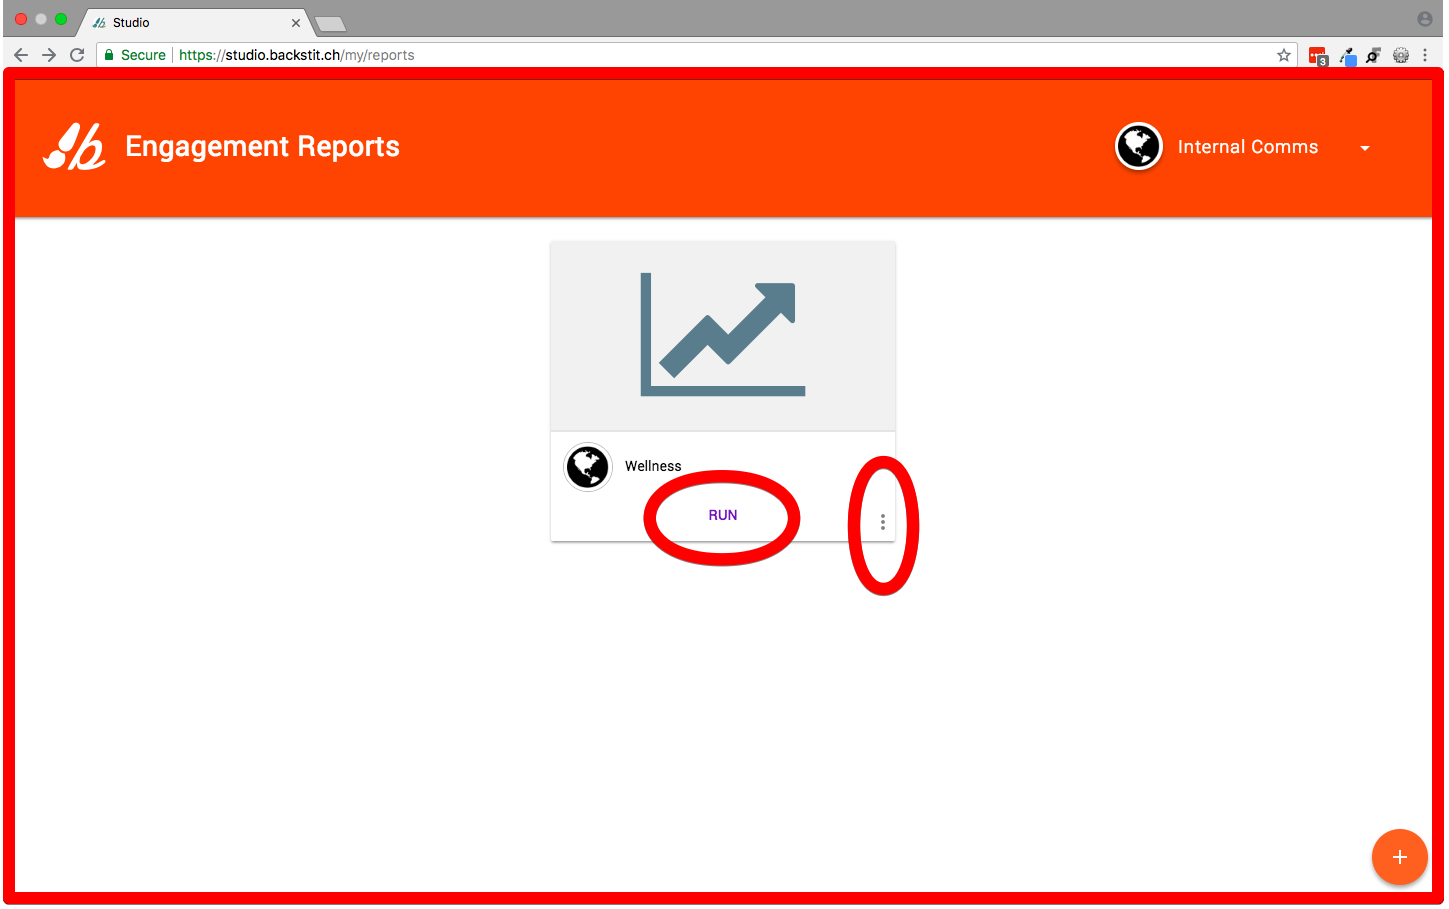
Step 2: View Engagement Reports Dashboard
- Here, you will find all the Engagement Reports you previously created.
- Select [Run] to view the results of that report or click the [kebab] icon to delete the report.
Step 3: Create New Reports
- To create a new report, click the circle [plus] button on the bottom right corner of your screen.
- Create your Engagement Report filters by time, by channel, by Post or by link.
- Select which type of report you’d like to run, then modify the report options.
- From this pop up, you can select which metrics you’d like to view — Total Click-Throughs, Unique Link clicks, Total Impressions, Unique Impressions and/or Unique Recipient Clicks.
- You can also filter by the time the Post was sent, from a particular category the Post is in, the device the Post was sent to and/or words contained within the Post or title.
Note: If you choose to leave the Engagement Reports page while the report is generating, your new Engagement Report will be accessible via a direct link sent to the same email currently being used to navigate Studio.
Step 4: Browse Reports
- Click on a specific report from the dashboard to view the analytics.
- Here, you can edit the settings by clicking the [Edit] button next to [Metrics] and [Dataset] on the left sidebar.
- Hover over the graph on the right to view the data. You can also select which metrics to view by clicking the options on the graph.
- If you notice on the left sidebar, you might see metrics including “Total Impressions” and “Unique Impressions”
- What’s the difference between the two?
- Well, “Total Impressions” refers to the overall number of times the message has been seen, while “Unique Impressions” refers to the actual number of people that saw the message. backstitch Studio knows if one person opens the post from multiple different channels. So “Unique Impressions” determines that number and only shows the total number of different people that saw the message.
- What’s the difference between the two?
Pro Tip: The order you select your metrics in is the order they will show up in the graph.
Step 5: Save Report
- To download your Engagement Report, click on the [save] icon on the top right corner of the report.
- From there, you will see a drop down menu giving you the option to print or save the report as a PDF, or save the graph as a JPEG, PNG or an SVG vector image.